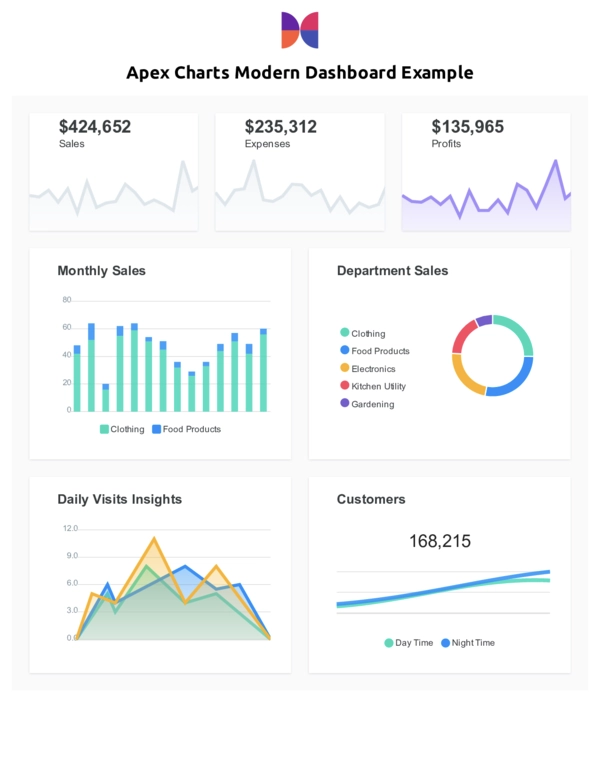
ApexCharts Modern Dashboard
apexcharts-modern-dashboard Chart template that can be used to show various data on a dashboard like interface with sparklines, barcharts, donuts, and more.
Highlights
- Prebuilt Apex Chart Dashboard.
- All charts can be customized by passing in data to the template.
- Each chart and section is optional and the layout will change respectively.
- Beautiful charting components arranged in a dashboard layout.
- Multilingual support - Supports multiple cultures for displaying proper number and date formats, currency symbols, and more.
- Full UTF-8 support
What is a Chart?
A chart is a graphical representation of data, using bars, lines, areas, pie charts, and other visual formats.
Disclaimer
The verbiage, vernacular, and terminology used in the forms, images, and any other type of media produced are suggestions. If the intention is to use these as legally binding documents for personal or business purposes, we recommend you seek an attorney's assistance to ensure you comply with all local laws and regulations.